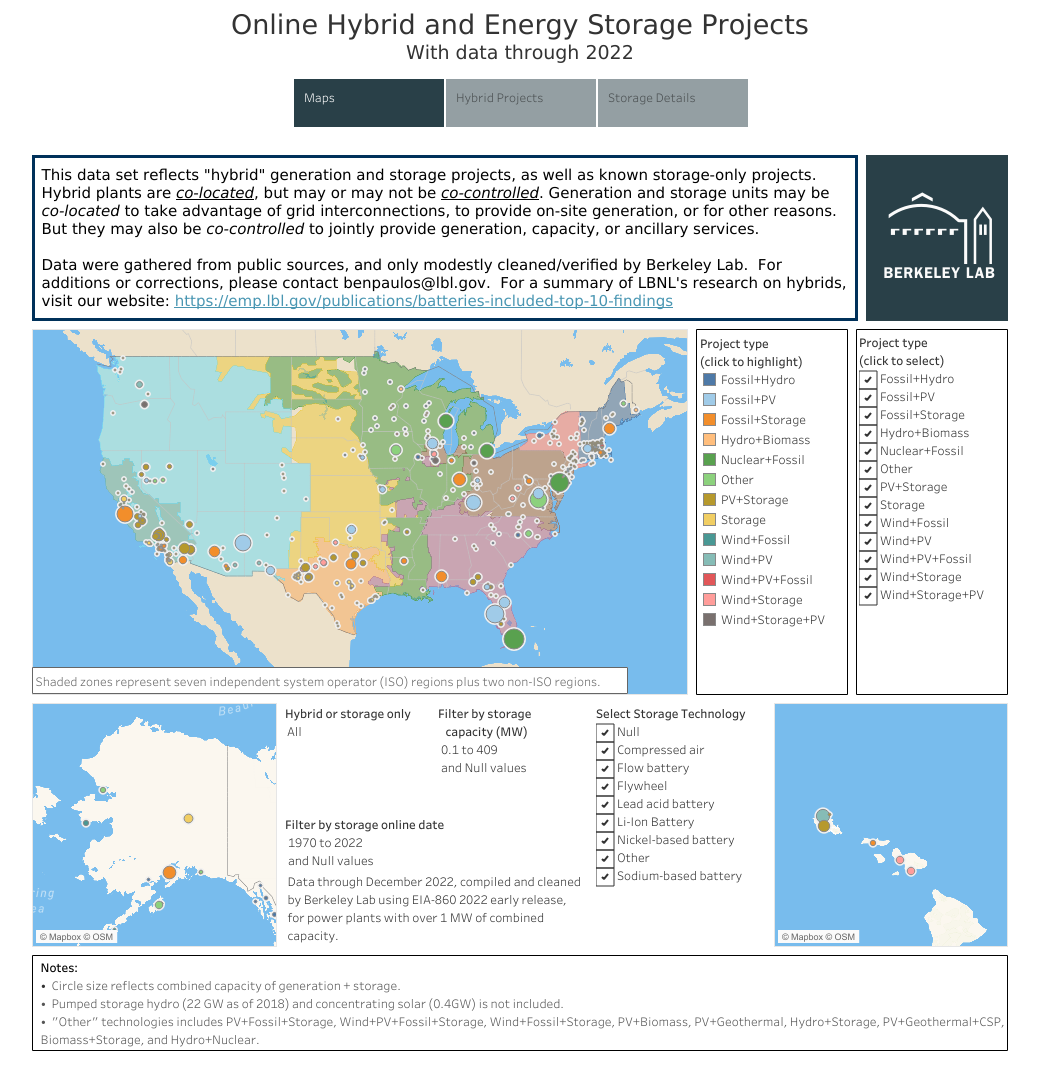
Updated data compilation from Berkeley Lab tracks operating and proposed plants
Improving battery technology and the growth of variable renewable generation are driving a surge of interest in “hybrid” power plants that combine, for example, utility-scale wind and/or solar generating capacity with co-located batteries. While most of the current interest involves pairing photovoltaic (PV) plants with batteries, other types of hybrid or co-located plants with wide-ranging configurations have been part of the U.S. electricity mix for decades.
A newly released briefing from Lawrence Berkeley National Laboratory tracks and maps both operating and proposed hybrid/co-located plants across the United States through the end of 2022 while also synthesizing data from power purchase agreements (PPAs). The scope of this data summary includes co-located hybrids that pair two or more resources (e.g., multiple types of generation and/or generation with storage) that are operated largely independently behind a single point of interconnection, and full hybrids that also feature coordinated operations of the co-located resources. ‘Virtual’ hybrids that are not co-located are excluded, as are smaller (often behind-the-meter) plants with less than 1 MW of generating capacity (i.e., our focus is on utility-scale plants).
This briefing is accompanied by two data visualizations, one focused on online plants and the other on those in interconnection queues, and an Excel data file with detail on individual plants. We will present this report during a free one-hour webinar on Thursday, September 21 at 1 PM Eastern. To register, go to: https://lbnl.zoom.us/webinar/register/WN_djSa2srJTgqEl92wVmF0Xg(link is external).
Key findings from this year’s update include the following:
Last year was another big year for hybrid plants in the United States. At the end of 2022, there were 374 hybrid plants (>1 MW) operating across the United States (+25% compared to the end of 2021), totaling nearly 41 GW of generating capacity (+15%) and 5.4 GW/15.2 GWh of energy storage (+69%/+88%). PV+storage plants are by far the most common and can be found throughout much of the country (see map), but there are nearly twenty other hybrid plant configurations in operation as well.
PV+storage is the most common type of hybrid. Among online generator+storage hybrids, PV+storage dominates in terms of plant number (213 in total, and 59 of the 62 hybrids added in 2022), storage capacity (4.0 GW/12.5 GWh), storage:generator capacity ratio (49%), and storage duration (3.1 hours).
Hybrid plant configurations reflect their primary use cases: The relatively high average storage ratio and duration of PV+storage plants suggest that storage is providing resource adequacy (i.e., capacity firming) and energy arbitrage (i.e., shifting power sales from lower- to higher-priced periods) capabilities to PV+storage plants. In contrast, the low average storage ratio (14%) and short duration (0.6 hours) of the relatively few operating wind+storage plants suggests that they are primarily targeting the ancillary services markets (e.g., providing regulation and/or reserves). Separate data reported by plant owners supports these intuitions about primary use cases.
Hybrid storage magnitudes are on par with standalone storage. As of the end of 2022, there was roughly as much storage capacity operating within PV+storage hybrid plants as in standalone storage plants (~4 GW each). In storage energy terms, however, PV+storage edged out standalone storage by ~2 GWh (12.5 GWh vs. 10.4 GWh, respectively).
Interconnection queue data show continued strong developer interest in hybridization. At the close of 2022, there were 51% more hybrid plants—representing 59% more generating capacity—in interconnection queues across the United States than there were at the end of 2021. Solar dominates these proposed plants as well: at the close of 2022, there were 457 GW of solar capacity proposed as a hybrid (representing ~48% of all solar capacity in the queues), most typically pairing PV with battery storage. At the same time, there were 24 GW of wind capacity proposed as a hybrid (representing ~8% of all wind capacity in the queues), again most-often pairing wind with storage. Meanwhile, more than half of all storage in the queues is estimated to be part of a hybrid plant. While many of the plants proposed in the queues will not ultimately reach commercial operations, the depth of interest in hybrid plants—especially PV+storage—is notable, particularly in certain regions. For example, in CAISO, 97% of all solar capacity and 45% of all wind capacity in the queues is proposed as a hybrid.![]()
PV+storage PPA prices, and in particular storage adders, have been rising. The report also surveys pricing data from 81 PV+storage PPAs in 10 states totaling 9.9 GW of PV and 5.5 GW/21.8 GWh of batteries. Forty-two of these 81 PPAs are from operating PV+storage plants, while the other 39 plants are still under construction or in development. Though PV+storage PPA prices have fallen over time (left graph, below), “levelized storage adders”—i.e., the incremental cost of adding batteries to a standalone PV PPA—have recently increased somewhat to ~$7000/MW-month, ~$60/MWh-stored (assuming one full cycle per day), or ~$15/MWh-PV (as shown in the right graph, below). Some of the recent price increase could simply reflect a trend towards higher battery:PV capacity ratios on the mainland over time (whereas this ratio is typically pegged at 100% in Hawaii), which will increase costs, all else being equal. The well-publicized impact of inflationary and supply chain pressures on battery prices is no doubt a contributor as well.
We do not see the IRA’s impact in this year’s update. The Inflation Reduction Act (IRA), which became law in August 2022, provides standalone storage with access to the investment tax credit (ITC) for the first time, thereby removing some of the impetus to couple battery storage with solar in a hybrid configuration. We do not yet see the potential impact of the standalone storage ITC on hybridization reflected in this year’s report, for several possible reasons. First, the IRA was passed relatively late in the year, with Treasury guidance on implementation coming even later, and the market naturally takes time to react. In addition, the new standalone storage ITC only came into effect starting in 2023, while this report focuses primarily on 2022. Meanwhile, interconnection queues from some of the bigger regions had either already closed their open application season by the time the IRA passed, or else did not accept or discouraged new interconnection requests in 2022. Finally, there are several countervailing reasons why the trend toward hybridization might continue despite the standalone storage ITC; in this year’s report, we explore some of those remaining advantages of hybridization through two case studies.
For further details on these and other findings, along with high-level case studies of two operating PV+storage plants, please refer to the short PowerPoint-style data compilation, which can be downloaded here. The briefing is also accompanied by two data visualizations, one focused on online plants and the other on those in interconnection queues, and an Excel data file with detail on individual plants.
We will present this report during a free one-hour webinar on Thursday, September 21 at 1 PM eastern. To register, go to: https://lbnl.zoom.us/webinar/register/WN_djSa2srJTgqEl92wVmF0Xg (link is external).

Online Hybrid and Energy Storage Projects, https://emp.lbl.gov/online-hybrid-and-energy-storage-projects
This work was courtesy of Berkeley Lab and funded by the U.S. Department of Energy, Office of Energy Efficiency and Renewable Energy, Solar Energy Technologies Office and Wind Energy Technologies Office.
I don’t like paywalls. You don’t like paywalls. Who likes paywalls? Here at CleanTechnica, we implemented a limited paywall for a while, but it always felt wrong — and it was always tough to decide what we should put behind there. In theory, your most exclusive and best content goes behind a paywall. But then fewer people read it! We just don’t like paywalls, and so we’ve decided to ditch ours. Unfortunately, the media business is still a tough, cut-throat business with tiny margins. It’s a never-ending Olympic challenge to stay above water or even perhaps — gasp — grow. So …


